This is the first post in a series documenting the development of Acheron, a binary analysis tool built entirely from scratch in Rust. We're targeting real world executables, starting with vkQuake a Vulkan-based Quake engine and working our way toward PS3 executables and PowerPC in later phases. Follow along as we figure out how decompilers actually work by building one.
Why "Acheron"?
Acheron is a river in Greek mythology, a "river of woe," which must be crossed by the deceased prior to entering the realm of Hades. In terms of dissecting a compiled program to extract its logic despite the complete lack of any kind of annotation, the description was quite apt. The code had died. It was our mission to resurrect it.
Not only that, but it sounded more interesting than "decompiler-project-v2."
Why build another decompiler?
The truth be told: I just really wanted too...
Software such as Ghidra, IDA Pro, and x64-DBG are amazing programs, containing decades' worth of information on executable formats, CPU architecture, types and semantics, and even compilers. But they are also black boxes. Whenever Ghidra tells you something like a function taking three parameters or that this variable being uint32_t, a complex chain of deductions happens behind the scenes which is completely unknown to you.
In contrast, Acheron works based on the principle of explainable decompilation, where every deduction made by the tool comes complete with the chain of reasoning behind it. How did the tool determine this block is a loop structure? What sequence was identified to enable null check detection? Which instruction set a condition for the branch? These are the questions that we aim to answer both in the output, and in the tool itself.
Then there's another reason, which is much simpler: it's a research project, and the research will not take place until we build the thing ourselves. The use of iced-x86 for decoding instructions would save us months of work. But at the same time, we'd never have to think about why r/m=100 in the ModRM byte signifies "next goes the SIB byte," and not "use RSP register." The learning occurs when we write the decoder ourselves.
And let me tell you something: nothing beats the sheer thrill of seeing a binary sequence you've never seen decoded into pseudo-C code. In fact, even when this decoding is done in a spectacularly incorrect way, there's always something new to learn.
The target: vkQuake
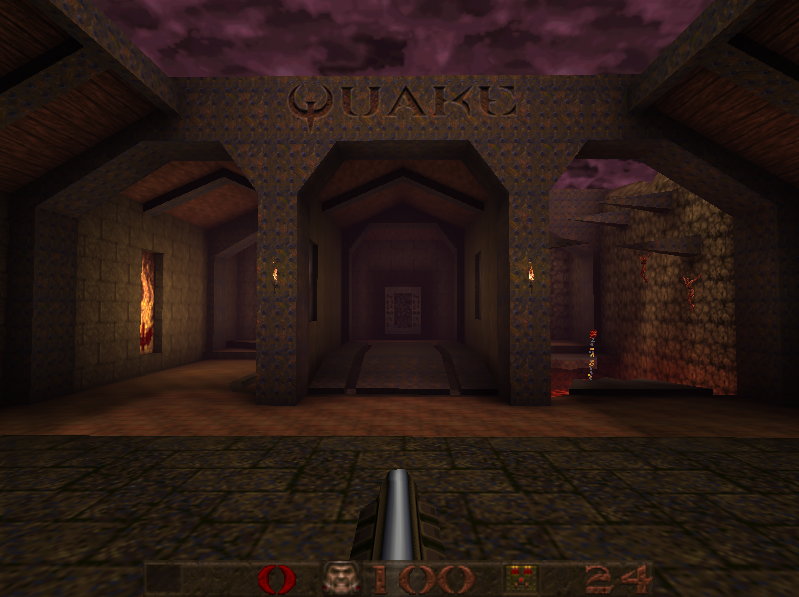
Our test subject is vkQuake.exe, a Vulkan-based port of the original Quake engine. I chose it for a few reasons:
- It's open source, so we can compare our results to the source code for verification, as we now have ground truth. If the decompiler says something about an array loop pattern, we can check how accurate it is compared to the actual source code. Such opportunities will be extremely valuable during the research when trying to distinguish between possible interpretations.
- It's not too big (about ~1.1MB), making navigation easier, but still, there is enough to explore for interesting structures, and after spending some time with it, it reveals a rich internal structure.
- It's compiled with modern toolchains, so we'll encounter MSVC/Clang codegen patterns, x64 calling conventions, and modern PE structure, all the things you'd see in production software.
- It has real game-loop architecture: init → load world → main loop → render/game update. Games have this beautiful clarity of structure that a lot of applications don't. There's a main loop. There's a render path. There are subsystem initializers. The code tends to organize itself into recognizable regions.
The PE folder also contains ezquake.exe (~5.2MB), which I considered but decided against as the starting point. Bigger isn't better when you're debugging a decoder, you want something you can reason about manually. We'll come back to ezquake later as a stress test.
One thing that surprised me: vkQuake (~1.1MB) is smaller than ezquake (~5.2MB) despite being a Vulkan renderer. The reason is probably because Vulkan is loaded dynamically at runtime, so the binary itself is lean. ezquake bundles a lot of resources and game assets directly in the executable.
The architecture
Before we write a single line of code, we need to know what we're building. A decompiler is fundamentally a pipeline: each stage takes the output of the previous one and adds another layer of understanding.

Here's what each stage does and why it exists:
PE Loader — reads the binary format and maps it into memory. Without this, we don't know where code is, what functions are exported, or what external libraries are being called. The PE format is surprisingly hairy (there's a DOS header at the front that exists purely for historical reasons) but the fundamentals are straightforward.
x64 Decoder — turns raw bytes into instructions. This is where we parse the actual instruction encoding, including all the REX prefix and ModRM/SIB complexity. We'll spend most of this post here.
Intermediate Representation (IR) — lifts architecture specific instructions into a cleaner, architecture neutral form. This is the foundation for everything that follows. A mov rax, [rbp-8] becomes rax = load64(rbp + -8), which is much easier to analyze.
CFG Construction — groups instructions into basic blocks and builds the graph of control flow between them. This is where we start to see the shape of the code: loops, if/else chains, switch statements.
SSA Transformation — converts the IR into Static Single Assignment form, where every variable is defined exactly once. This sounds like a pedantic academic constraint but it has a dramatic practical effect: analysis becomes much simpler because you never have to ask "which write of this variable am I reading?"
Analysis Passes — a collection of passes that extract higher level information: stack frame layout, function arguments, variable types, common code patterns.
Pseudo-C Generator — takes all the above and produces something a human can read easier. It's not valid C, it won't compile, but it's close enough to reason about.
Slint UI — displays all of the above in a four pane layout: assembly, IR, pseudo-C, and analysis results side by side. This design will likely change but for now this is what I settled on.
The PE format: not as scary as it looks
The Portable Executable format is the container format for Windows executables. Before we can decode any instructions, we need to understand what's in the file and where code lives.
A PE file looks like this from the outside:
0x0000  DOS Header      (64 bytes, legacy MS-DOS stub)
0x003C  e_lfanew        (4 bytes: offset to the real PE header)
...     DOS stub        (small 16-bit MS-DOS "This program cannot be run in DOS mode" program)
[e_lfanew] PE Signature (4 bytes: "PE\0\0")
        File Header     (20 bytes: machine type, section count, timestamp)
        Optional Header (variable: image base, entry point, data directories)
        Section Table   (40 bytes per section)
[section] .text         (code)
[section] .rdata        (read-only data: strings, vtables, constants)
[section] .data         (initialized global data)
[section] .idata        (import table)
...
The "Optional Header" is misnamed, it's not optional at all in modern PE files. The name comes from the COFF object file format that PE evolved from, where it actually was optional. In PE files it's always present and contains critical information like the preferred load address (image_base) and the entry point RVA.
An RVA (Relative Virtual Address) is an address measured from the start of the loaded image in memory. The file on disk has a different layout than what gets loaded, sections are mapped at specific virtual addresses that may not match their file offsets. Converting between the two is one of the first things the loader needs to handle:
// from src/pe/sections.rs
pub fn rva_to_offset(&self, rva: u32) -> Option<u32> {
    if rva >= self.virtual_address && rva < self.virtual_address + self.virtual_size {
        Some(self.raw_offset + (rva - self.virtual_address))
    } else {
        None
    }
}
Every section knows its own RVA and file offset, so converting any RVA is a matter of finding which section contains it and applying the offset delta.
Entropy: a free signal
One thing I baked in from day one is a Shannon Entropy calculation for each section:
// from src/pe/sections.rs
pub fn compute_entropy(data: &[u8]) -> f64 {
    if data.is_empty() { return 0.0; }
    let mut counts = [0u64; 256];
    for &b in data { counts[b as usize] += 1; }
    let len = data.len() as f64;
    counts.iter()
        .filter(|&&c| c > 0)
        .map(|&c| { let p = c as f64 / len; -p * p.log2() })
        .sum()
}
Entropy measures how random the bytes are, on a scale from 0 to 8. Normal code sits around 5–6. Compressed data sits at 7.5+. Encrypted data is near 8. This is a free signal that tells you immediately whether a section has been packed or encrypted, without decoding a single instruction (which when I'm manually analyzing executables I find extremely helpful).
Imports: the cross-reference map
The import table tells us which external functions the binary calls, which is invaluable for understanding what code does without reversing it. CreateWindowExW being called tells you a lot before you look at a single byte of surrounding code. We parse all of this into a flat map of IAT_RVA → "DLL!FunctionName" that we can use to label call targets later:
// from src/pe/loader.rs
pub fn iat_label(&self, rva: u32) -> Option<String> {
    for import in &self.imports {
        for func in &import.functions {
            if func.iat_rva == rva {
                return Some(format!("{}!{}", import.dll_name, func.display_name()));
            }
        }
    }
    None
}
The decoder: welcome to the worst encoding in modern computing
x64 instruction encoding is the result of 40 years of backwards compatibility requirements. We're running 1978 8086 instruction encodings, extended in 1985 for 386, extended again in the early 2000s for AMD64, all while maintaining compatibility at every step. The result is... interesting.

Every instruction looks like this:
[optional prefixes] [optional 0x0F escape] [opcode] [optional ModRM] [optional SIB] [optional displacement] [optional immediate]The tricky parts:
REX prefix: the x64 extension
In 64-bit mode, a byte in the range 0x40–0x4F immediately before the opcode is a REX prefix. Its four meaningful bits are:
REX.W(bit 3): use 64-bit operand size instead of 32-bitREX.R(bit 2): extend theregfield in ModRM from 3 to 4 bits (gives us r8–r15)REX.X(bit 1): extend theindexfield in SIBREX.B(bit 0): extend ther/mfield in ModRM, or the register field in opcode encoding
// from src/decoder/prefixes.rs
#[derive(Debug, Clone, Copy, Default)]
pub struct RexPrefix(pub u8);

impl RexPrefix {
    pub fn w(&self) -> bool { self.0 & 0x08 != 0 }  // 64-bit operand
    pub fn r(&self) -> bool { self.0 & 0x04 != 0 }  // ModRM.reg extension
    pub fn x(&self) -> bool { self.0 & 0x02 != 0 }  // SIB.index extension
    pub fn b(&self) -> bool { self.0 & 0x01 != 0 }  // r/m or opcode reg extension
}
The REX prefix must be the last prefix before the opcode. This matters because there are other prefix bytes (segment overrides, operand size, address size) and they can appear in any order, but once you see a REX byte, you know the opcode follows immediately.
ModRM: two operands in one byte
Most two operand instructions have a ModRM byte that encodes both operands. The three fields are:
mod(2 bits): 00=indirect, 01=disp8, 10=disp32, 11=register directreg(3 bits): first register, or opcode extension for single operand formsr/m(3 bits): second register or memory base, depending onmod
The edge cases that tripped me up:
- When
mod=11, it's a register. Simple. But whenmod=00andr/m=101, it means RIP-relative addressing —[RIP + disp32]. This is the dominant way 64-bit code accesses global variables because ASLR means you can't use absolute addresses. - When
r/m=100(which would encode RSP), it instead means a SIB byte follows. RSP as a base register can't be encoded in ModRM alone. - The SIB byte itself has the same shape:
scale(2),index(3),base(3). But whenindex=100, that means no index register (not RSP). And whenbase=101withmod=00, that means disp32 with no base register.
Here's the core decode logic:
// from src/decoder/decode.rs (simplified)
fn decode_rm(&self, buf: &[u8], mut i: usize,
    modfield: u8, rm: u8, size_bits: u8,
    rex: Option<RexPrefix>
) -> Option<(Operand, usize)> {
    let rex_b = rex.map(|r| r.b()).unwrap_or(false);
    let start = i;

    let op = if modfield == 3 {
        // register direct
        Operand::Reg(Register::from_index(rm, rex_b), size_bits)
    } else {
        if rm == 4 {
            // SIB byte present (RSP encoding means "has SIB")
            let sib = buf[i]; i += 1;
            let scale = 1u8 << ((sib >> 6) & 3);
            let sib_idx = (sib >> 3) & 7;
            let sib_base = sib & 7;
            let index = if sib_idx == 4 { None } // RSP in index = no index
                else { Some(Register::from_index(sib_idx, rex.map(|r| r.x()).unwrap_or(false))) };
            // ... displacement based on mod field
        } else if rm == 5 && modfield == 0 {
            // RIP relative: [RIP + disp32]
            let disp = i32::from_le_bytes(...) as i64;
            Operand::Mem(MemOperand::rip_relative(disp, size_bits))
        } else {
            // simple base + displacement
            let base = Register::from_index(rm, rex_b);
            // ...
        }
    };
    Some((op, i - start))
}
None of this is particularly complicated once you've read it a few times. The frustration is that it requires holding multiple interacting rules in your head simultaneously and the encoding spec was clearly designed by someone who was optimizing for hardware simplicity in 1981, not for human readability forty years later.
Intermediate Representation: giving the machine a common language
Raw x64 instructions are too architecture specific to analyze well. Different instructions set flags in different ways, register aliasing means eax and rax are the same physical register at different widths, and common idioms like xor eax, eax (zero a register) look very different from what they semantically mean (eax = 0).
The IR gives us a layer where all of these are normalized:
// assembly:
mov rax, [rbp-0x8]   ->  IR: rax = load64(rbp + -0x8)
add rax, 5           ->  IR: t0 = rax + 0x5
                              rax = t0
                              ZF = (t0 == 0)    // explicit flag assignment
xor ecx, ecx         ->  IR: t1 = ecx ^ ecx
                              ecx = t1
                              // optimizer later: ecx = 0
Every IR operation has an explicit destination, explicit sizes, and explicit flag updates. There are no implicit side effects. If an instruction sets ZF, we emit a separate ZF = ... assignment.
// from src/ir/op.rs
pub enum IrOp {
    Assign(IrValue),
    BinOp(BinOp, IrValue, IrValue),
    Load(IrValue, u8),                // addr, size_bits
    Store(IrValue, IrValue, u8),      // addr, value, size_bits
    ZExt(IrValue, u8),
    SExt(IrValue, u8),
    Call(IrValue, Vec<IrValue>),
    Jump(usize),
    Branch(IrValue, usize, usize),    // condition, true_block, false_block
    Return(Option<IrValue>),
    Phi(Vec<(usize, IrValue)>),       // SSA phi node
    Unsupported(String),              // keeps unknown instructions visible
}
The Unsupported variant is important, rather than silently dropping instructions we don't recognize yet, we keep them in the IR as annotated placeholders. This means the analysis output is always complete (if approximate), and we can see exactly which instructions we haven't handled yet.
Control Flow Graph: mapping the shape of code
A basic block is the fundamental unit of a CFG: a straight line sequence of instructions with one entry point and one exit point. The exit is always either a branch, a call followed by fall through, or a return.

Building the CFG is a two pass process:
Pass 1 — find all leaders. A leader is any instruction that can be the start of a basic block:
- The function entry point
- Any target of a branch instruction
- The instruction immediately after any branch
// from src/cfg/builder.rs
// while scanning linearly:
if inst.mnemonic.is_branch() {
    if let Some(t) = inst.branch_target {
        branch_targets.push(t);     // target is a leader
    }
    leaders.insert(va + len as u64);  // instruction after branch is a leader
}
Pass 2 — build blocks from leaders. For each leader, scan forward until we hit a terminator (branch, ret) or the next leader, whichever comes first.
The edges in the graph come naturally from the branch instructions:
- Unconditional
jmp target→ one successor (target) - Conditional
jz target→ two successors (target + fall-through) ret→ no successors
One thing that caught me: indirect jumps like jmp rax or jmp [rcx*8+.text] (switch tables). We can't resolve these statically without further analysis, so they produce an "unresolved" successor marker. This is fine for now, I'll add switch table recovery later.
Dominators and loops
Once we have the CFG, we compute the dominator tree. Block A dominates block B if every path from the function entry to B must pass through A. This relationship is the foundation of both loop detection and SSA construction.
A back edge is an edge from block B to block A where A dominates B (i.e., we're going "backwards" up the dominator tree). Back edges are exactly the loop edges. A loop header is a block targeted by a back edge:
// from src/cfg/dominator.rs
pub fn find_loop_headers(&self, cfg: &Cfg) -> Vec<usize> {
    let mut headers = Vec::new();
    for b in 0..cfg.blocks.len() {
        for succ_addr in &cfg.blocks[b].successors {
            if let Some(&succ_id) = cfg.addr_to_block.get(succ_addr) {
                if self.dominates(succ_id, b) {
                    // succ_id dominates b, and there's an edge from b to succ_id
                    // that's a back edge -> succ_id is a loop header
                    headers.push(succ_id);
                }
            }
        }
    }
    headers
}
When the analysis panel shows "loop headers: [2, 7]", that means blocks 2 and 7 are the entry points of loops, something the pseudo-C should eventually reconstruct as while or for.
SSA: every variable defined exactly once
Static Single Assignment form adds version numbers to every variable definition:
// before SSA:
block_0:
  rax = load64(rbp + -8)
  rax = rax + 5

// after SSA:
block_0:
  rax_0 = load64(rbp + -8)
  rax_1 = rax_0 + 5
This looks trivial for straight line code. The interesting part is what happens at merge points in the CFG (places where two different paths come together). At those points, the variable might have different values depending on which path was taken. SSA handles this with phi nodes:
// two branches that both write eax, then merge:
block_1 (true branch):  eax_1 = 1
block_2 (false branch): eax_2 = 0

block_3 (merge):
  eax_3 = φ(block_1: eax_1, block_2: eax_2)
  // eax_3 is 1 if we came from block_1, 0 if from block_2
The phi node isn't a real instruction (it doesn't exist in the machine code). It's a bookkeeping device that says "this variable could be one of several things depending on control flow." After SSA, every use of a variable unambiguously refers to exactly one definition, which makes later analysis (type inference, constant propagation, dead code elimination) dramatically simpler.
The algorithm for inserting phi nodes uses dominance frontiers: the set of blocks where a definition from block B "just stops dominating." These are exactly the blocks where phi nodes need to go. We use the standard Cytron et al. (1991) algorithm, with Cooper et al.'s (2001) simple iterative dominator computation underneath it.
Analysis: what does the code actually do?
With SSA-form IR and a CFG, we can start asking real questions.
Stack frame recovery
We scan the IR for all load and store operations whose address is rbp + constant. Each unique offset becomes a stack variable candidate:
// from src/analysis/stack.rs
IrOp::Load(addr, bits) => {
    if let Some(off) = extract_rbp_offset(addr) {
        let entry = accesses.entry(off).or_insert((*bits, 0));
        entry.1 += 1; // count accesses
    }
}
Negative offsets from RBP are locals. Positive offsets are arguments (or the saved return address). The Microsoft x64 ABI reserves specific offsets for the first four arguments:
[rbp+0x10]  <-  arg0 (rcx shadow space)
[rbp+0x18]  <-  arg1 (rdx shadow space)
[rbp+0x20]  <-  arg2 (r8 shadow space)
[rbp+0x28]  <-  arg3 (r9 shadow space)
[rbp-0x08]  <-  first local variable
[rbp-0x10]  <-  second local variable
...
Calling convention analysis
For the Microsoft x64 ABI, the first four integer arguments go in rcx, rdx, r8, r9. We detect function parameters by finding which argument registers are read before being written in the function's entry block, those are incoming arguments:
// from src/analysis/calling_convention.rs
for inst in &entry.insts {
    let uses = collect_var_uses(&inst.op);
    for u in uses {
        if MS_X64_ARG_REGS.contains(&u.as_str()) && !defined.contains(&u) {
            // used before defined -> it's a parameter
            used_before_defined.push(u.clone());
        }
    }
    if let Some(d) = &inst.dest { defined.insert(d.name.clone()); }
}
Pattern recognition
Some code patterns are so common and so distinctive that recognizing them directly produces better output than general analysis:
xor reg, reg→ zero idiom. Compilers emit this instead ofmov reg, 0because it's one byte shorter and sets flagstest reg, reg; jz/jnz→ null check. Reading flags fromtest reg, regis a standard Cif (ptr != NULL)patternpush rbp; mov rbp, rspat the entry of a block → standard frame pointer setupsub rsp, Nnear function entry → stack frame allocation of N bytes
// from src/analysis/pattern.rs
// xor reg, reg -> zero
if inst.mnemonic == Mnemonic::Xor {
    if let (Some(Operand::Reg(r1, _)), Some(Operand::Reg(r2, _))) =
        (inst.operands.get(0), inst.operands.get(1))
    {
        if r1 == r2 {
            // confidence 1.0: this is ALWAYS a zero idiom
            matches.push(PatternMatch {
                kind: PatternKind::ZeroRegister,
                confidence: 1.0,
                description: format!("{} = 0  // xor self zero idiom", r1.name(64)),
                // ...
            });
        }
    }
}
Every pattern match carries a confidence score and a human readable description of why the pattern was recognized. This feeds directly into the analysis panel in the UI.
Pseudo-C: good enough to read
The pseudo-C generator takes all of the above and produces something approximating C. We're not trying to produce compilable code, just something readable.
The current approach is a goto based fallback: emit each basic block with a label, and represent branches as if (cond) goto label_X; else goto label_Y;. This is always correct (it exactly mirrors the CFG structure) even if it's not the prettiest output. Lifting this into actual if/else and while structures is the next step, however it requires structural analysis of the dominator tree, which we'll cover in a future post.
Here's what the output looks like for a simple function:
// function at 0x140001000
int64_t init_renderer(int64_t rcx, int64_t rdx) {
int64_t local_8; // [rbp-0x8]
int64_t local_10; // [rbp-0x10]
label_0x140001000:
local_8 = rcx;
local_10 = rdx;
t0 = load64(rcx + 0x28);
if (t0 == 0) goto label_0x140001042; else goto label_0x14000101a;
label_0x14000101a:
t1 = local_8 + 0x10;
/* ... */
return rax;
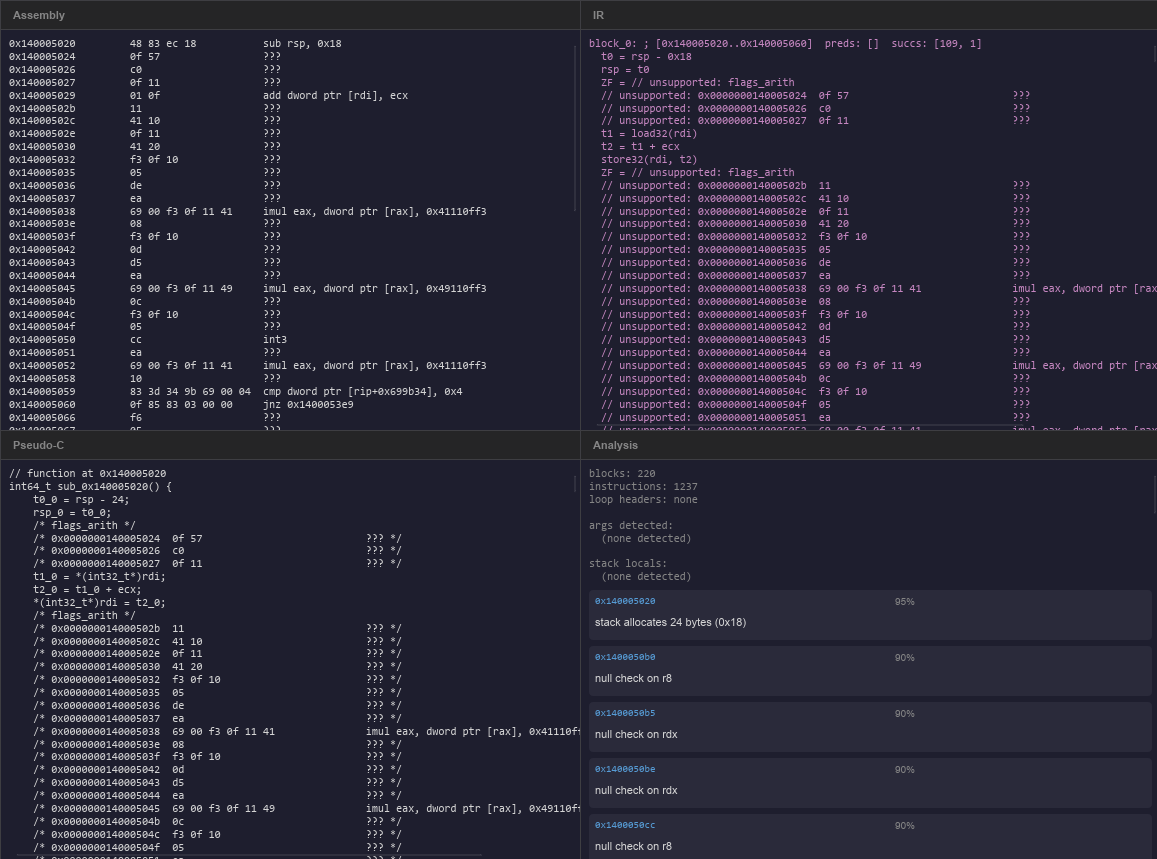
}Not beautiful. But readable. And every line traces back to a specific IR instruction, which traces back to a specific address, which traces back to specific bytes in the binary. The full chain is always there.
The UI
The software is written with the help of slint, which is a framework for writing user interfaces natively in Rust. I have opted to use this instead of something like egui because I have been working on other projects where I have used slint more extensively, and it resembles creating React components quite nicely.
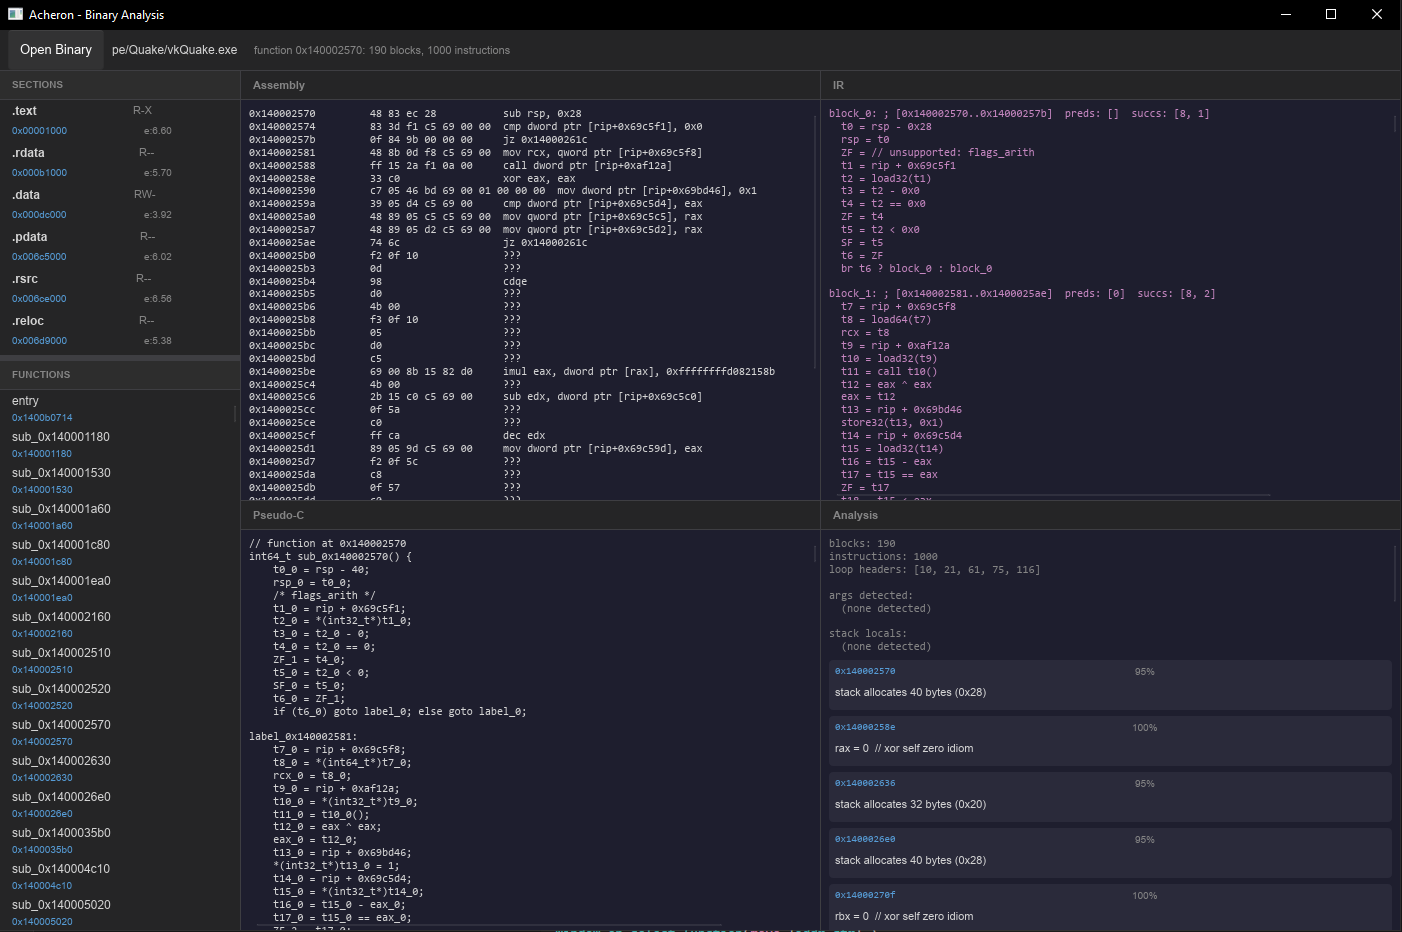
The current design is deliberately simple: four panels, dark interface, monospace font for everything. The current design choices are really just because I'm more focused on getting the early stuff right vs building something pretty, that can come later. Each panel represents one of the four levels of the analysis, and for now that's exactly what we need.
One thing I have learned while building UI (especially in slint): all heavy analysis must run off the UI thread. Slint's event loop is single threaded, so any work done in a callback blocks rendering. For example when clicking a function entry the correct way to load / analyze it is to snapshot the data on the UI thread (fast, just a Vec clone), then std::thread::spawn the analysis, then use slint::invoke_from_event_loop to send results back:
// from src/main.rs
window.on_select_function(move |addr_str| {
    // immediately show feedback
    win.set_status_text("analyzing...".into());

    // snapshot PE data on UI thread (cheap)
    let snapshot = state.lock().unwrap().snapshot_for_analysis(addr);

    // heavy work on background thread
    std::thread::spawn(move || {
        let result = analyze_function_bg(snapshot);

        // push results back to UI thread
        slint::invoke_from_event_loop(move || {
            win.set_assembly_text(/* formatted string */);
            win.set_ir_text(/* formatted string */);
            // ...
        }).ok();
    });
});
For now this is fine, eventually I'm going to more heavily think about the UI ↔ backend communication pipeline to make the front end as responsive, clean, and elegant from both a UI and UX experience as possible.
What vkQuake looks like from the inside
Loading vkQuake, a few things are immediately visible:
The entry point is not main. — The PE entry point (where execution actually starts) is the CRT startup stub, a small function that initializes the C runtime, calls global constructors, then calls main. This is standard for MSVC compiled executables and it's something to watch for: clicking "entry" will give you CRT init code, as expected this is the entry point not game code.
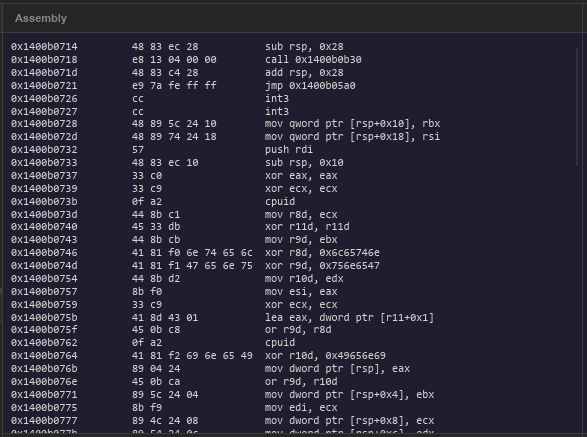
Pattern recognition fires immediately. — The entry block has the push rbp; mov rbp, rsp frame setup, and multiple xor reg, reg zero idioms are visible in the first twenty instructions. The analyzer correctly identifies these with high confidence.
The import table is rich. — vkQuake imports from vulkan-1.dll, user32.dll, kernel32.dll, winmm.dll, and several others. Just reading the import table gives you a rough map of what the application does: it creates windows, plays audio, uses Vulkan for rendering, and uses standard Win32 APIs for file I/O and threading.
Entropy tells an interesting story. — The .text section (code) has entropy around 5.9. The .rdata section (constants/strings) is lower at around 4.8. No sections are suspiciously high, this binary isn't packed which makes it a clean analysis target.
What went wrong along the way
A research project wouldn't be honest without a list of things that broke. And quite a few things broke.
The CFG fall-through bug. The condition for adding a fall-through edge was inverted !block.successors.is_empty().then(|| true).unwrap_or(false) evaluates to true when is_empty() returns false, which is backwards. The result was that blocks that already had successors got an extra fall-through, and blocks that needed one didn't get it. The fix was obvious once found; finding it took longer than it should have.
Slint border properties. The initial UI used border-bottom-width, border-right-width etc. for dividers between panes. Slint doesn't have directional border properties, it only has border-width (uniform, all sides). The fix was to use thin Rectangle elements as explicit dividers. Annoying, but cleaner in the end.
IAT thunks in the function list. The first version added every import address table entry to the sidebar function list. IAT entries are data pointers (they get patched by the loader with real function addresses at startup) and they point to the .idata section, not executable code. Clicking one caused the decoder to chew through 4096 bytes of garbage data, emitting ??? for every byte. The fix was simple: don't add IAT entries to the function list. They're useful as cross-reference labels but not as analysis targets.
SSA rename stack overflow. The original SSA variable renaming pass was recursive, it walked the dominator tree via Rust function calls, one frame per block. Elegant on paper, but on Windows, where the default thread stack is 1MB, a function with 200+ basic blocks would quietly overflow and crash. The fix was to convert the recursion to an explicit work stack: a Vec of (block_id, is_return_visit, vars_to_pop) tuples. The is_return_visit flag simulates the "returning up the tree" phase where you'd normally pop variable version scopes as you unwind. It's not pretty code, but it doesn't have a stack size limit, which matters more.
The lesson here is if you're recursing over something proportional to user input, make it iterative. Games in particular have been known to have functions with enormous control flow graphs, a switch statement with 200 cases becomes 200 basic blocks.
The decoder is incomplete. We can't decode SSE/AVX instructions yet, most of the 0x0F two-byte opcode space is missing, and there are a handful of common one-byte opcodes we haven't encountered yet. This is fine because we're filling in the decoder as we actually encounter opcodes in vkQuake.
What's next
Phase 1 is functional but far from complete. The next posts in this series will cover:
Part 2 — Structural Analysis: lifting goto based pseudo-C into actual if/else, while, and for constructs. This requires matching dominator tree patterns against known control flow structures. It's where the pseudo-C starts looking like something a human might have written.
Part 3 — Type Recovery: figuring out that a variable is a pointer, that an array is being indexed, that a struct field is being accessed. Type inference from usage patterns is the hardest part of decompilation and the results are always approximate, but even getting obvious cases right dramatically improves readability.
Part 4 — Function Discovery: moving beyond entry point + exports to find every function in the binary. CALL target harvesting, prologue pattern matching, and eventually gap analysis (regions of code not reachable from any known function).
Part 5 — Compiler Fingerprinting and vkQuake Archaeology: looking at the actual patterns in vkQuake, figuring out what compiler produced this, identifying standard library routines, and mapping the high-level game architecture from the binary alone.
At the end of Phase 1 we'll have a usable research tool and a clear picture of what x64 decompilation actually involves. Then in Phase 2 we turn to PS3 .SELF files, the PowerPC64 architecture, and the very different world of console executable formats, but something I am very familiar with and a fun addition to the codebase.
Code is currently not available but will be published once cleaned up a bit hopefully with part 2.