In Part 1 we built the pipeline: PE loader, x64 decoder, IR lifter, CFG builder, SSA, and a basic pseudo-C generator. The output was technically correct but painful to look at, every branch was a goto, every condition was a raw SSA flag expression like ZF_42 == 0. This post covers the work to fix that: structural control flow recovery, condition simplification, a post-dominator tree, switch table handling, and finally a visual CFG graph view that finally makes Acheron feel like a real tool.
The problem with gotos
At the end of Part 1, the pseudo-C output for a simple if/else looked something like this:
label_0x140001000:
    t0 = load64(rcx_0 + 0x28);
    if (ZF_3 == 0) goto label_0x14000101a; else goto label_0x140001042;

label_0x14000101a:
    t1 = local_8 + 0x10;
    goto label_0x140001058;

label_0x140001042:
    t2 = load64(rcx_0 + 0x30);
    goto label_0x140001058;

label_0x140001058:
    ...
That's not wrong. Every goto corresponds to a real edge in the CFG, every condition corresponds to a real branch, and every SSA variable is correctly versioned. The problem though is that this is exactly what Hex-Rays used to look like in 2001, before structural analysis got good. The code has a shape, there's a clear if/else diamond with a join block, and the goto representation throws that shape away.
Part 2 is about getting that shape back.
Structural analysis: matching patterns on the dominator tree
The key insight behind structural control flow recovery is that the dominator tree already encodes the structure we want. If a block dominates both branches of an if/else and there's a join block where both paths converge, that's an if/else. If a block dominates itself through a back edge, that's a loop. These patterns are recognizable from the dominator relationships alone, without doing any heroic graph manipulation.
The algorithm is a recursive schema matcher that starts at the entry block and works its way down:
- Loop header? — if there's a back edge pointing to this block (this block dominates one of its predecessors), wrap the region in a
whileordo-while. - Conditional branch with dominated successors? — if the block branches to two successors and dominates both, it's an if/else. If it dominates only one, the other is the join (it's an if-only).
- Single dominated successor? — just a sequence, keep going.
- Fallback — emit
goto label_Xand move on. Pathological CFGs always fall through gracefully.
The output of the algorithm is a tree of StructNode variants:

// from src/analysis/structuring.rs
pub enum StructNode {
Block(usize),
Sequence(Vec<StructNode>),
WhileLoop { header: usize, body: Box<StructNode>, exit: Option<usize> },
DoWhile { body: Box<StructNode>, latch: usize, exit: Option<usize> },
IfElse { header: usize, then_node: Box<StructNode>, else_node: Box<StructNode>, join: Option<usize> },
IfOnly { header: usize, then_node: Box<StructNode>, join: Option<usize> },
Switch { header: usize, cases: Vec<StructNode>, join: Option<usize> },
Goto(usize),
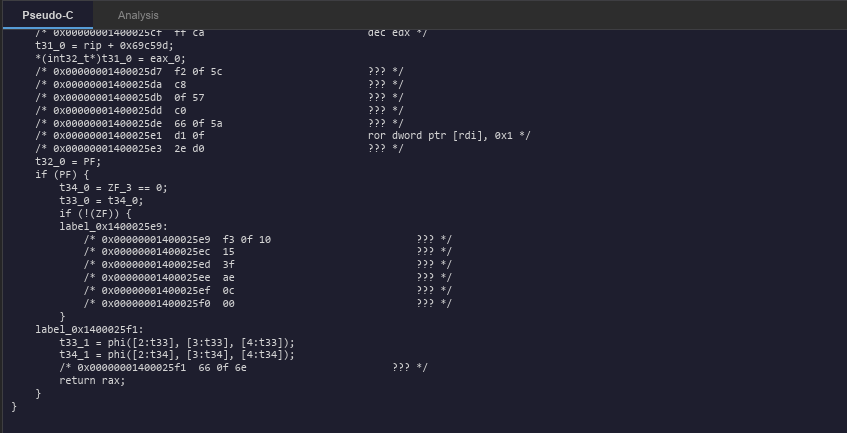
}The pseudo-C generator does two passes: a structured pass that walks the tree and emits indented if/while/{ blocks, tracking which block IDs it has already emitted, then an unstructured pass for any remaining blocks as labeled goto fallback. Well structured functions come out clean. Functions with irreducible CFGs (rare but real) silently fall back to gotos without losing any code.
Here is what the output looks like for the same function as above, after structural analysis:
// function at 0x140001000
int64_t sub_140001000(int64_t rcx) {
    t0 = load64(rcx + 0x28);
    if (t0 != 0) {
        t1 = rcx + 0x10;
        // ... then branch
    } else {
        t2 = load64(rcx + 0x30);
        // ... else branch
    }
    // ... join block continues
}
Still not beautiful, the variable names are still temporaries, but the structure is right. You can read it.
Finding the join block: why we needed a post-dominator tree
Here's the part that broke the first version. To emit an if/else, you need to know where the join block is (the block where both branches converge). My first attempt was a bounded BFS from both successors: find the first block reachable from both sides. That mostly worked on textbook examples but misfired on nested diamonds and loop exits.
The real answer was the post-dominator tree. Block A post-dominates block B if every path from B to any exit node in the function must pass through A. The immediate post-dominator of the if-header is exactly the join block, by definition.

The implementation is the same Cooper 2001 iterative algorithm we already use for the forward dominator tree, just run on the reversed CFG. The trick is adding a virtual exit node (index n, where n is the block count) with edges from all real exit blocks (blocks with no successors) so the reversed graph has a single entry point to start the DFS from.
// from src/cfg/postdom.rs
pub struct PostDomTree {
    pub idom: Vec<usize>,  // idom[i] = immediate post-dominator of block i
    pub n_real: usize,
}

impl PostDomTree {
    pub fn compute(cfg: &Cfg) -> Self {
        let n = cfg.blocks.len();
        let exit_node = n; // virtual

        // build reverse adjacency: for each edge a->b in CFG, add b->a in reverse
        let mut rev_adj: Vec<Vec<usize>> = vec![vec![]; n + 1];
        for b in &cfg.blocks {
            for &sa in &b.successors {
                if let Some(&tid) = cfg.addr_to_block.get(&sa) {
                    rev_adj[tid].push(b.id);
                }
            }
            if b.successors.is_empty() {
                rev_adj[exit_node].push(b.id); // exit node -> real exits
            }
        }
        // ... then Cooper 2001 intersection on the reverse graph
    }

    pub fn ipdom(&self, b: usize) -> Option<usize> {
        let p = self.idom[b];
        if p == b || p == self.n_real { None } else { Some(p) }
    }
}
Replacing the BFS approximation with postdom.ipdom(header) fixed join detection for nested diamonds and arbitrary CFG shapes. It's one of those changes where the code gets shorter and more correct at the same time.
The condition strings: tracing backwards through SSA
The other thing that was obviously broken: branch conditions in the output looked like ZF_42 == 0 instead of rcx != rdx. Everything you needed to understand the condition was there in the SSA. The flag variable traced back to a cmp, the cmp had the original operands, but nothing was following the chain.
The condition simplifier is a backwards tracer. It takes the IrValue at a Branch instruction and walks backwards through the current block's instruction list:

// from src/analysis/condition.rs
pub fn simplify_cond(cond: &IrValue, home_block: &IrBlock, all_blocks: &[IrBlock]) -> String {
    match cond {
        IrValue::Var(v) => {
            // find last definition of v in this block, then recurse
            if let Some(inst) = find_last_def(v, home_block) {
                simplify_op(&inst.op, home_block, all_blocks)
            } else {
                format_var(v)
            }
        }
        IrValue::Const(c, _) => format!("{:#x}", c),
    }
}
The chain for a cmp rcx, rdx followed by jnz goes like this:
br condition = t42
t42 = ZF_3 == 0         <- "ZF is 0" means the zero flag was not set
ZF_3 = t40              <- ZF was assigned from t40
t40 = rcx_2 == rdx_1    <- t40 is the equality comparison from the cmp
The simplifier traces that chain, sees ZF_3 == 0 (meaning "negate the ZF condition"), follows ZF_3 back to t40, follows t40 back to rcx_2 == rdx_1, and then negates the whole thing: rcx_2 != rdx_1.
The negate_cmp helper does structural operator inversion (== becomes !=, < becomes >=, and so on), and falls back to !(cond) if it doesn't recognize the pattern.
Compound flag expressions: signed comparisons
Signed comparisons were the fun part. The jl (jump-if-less) instruction fires when SF != OF, the sign flag and overflow flag disagree. Lifting this naively to SF_7 != OF_7 is correct but useless.
The simplifier handles this by recognizing the SF != OF pattern and tracing backwards: follow SF back through the assignment chain until you reach the BinOp::Slt that the cmp instruction emitted. That Slt has the original operands rcx, rdx so you can just output rcx < rdx directly without needing to reason about OF at all.
For compound patterns like jle (ZF | (SF != OF)), the simplifier fuses: if the or-branch resolves to a == b and the other resolves to a < b, the merged result is a <= b. Same approach for jg: if you have !ZF & (SF == OF), that fuses to a > b. These aren't perfect (they rely on both sub-expressions tracing back to the same cmp), but they handle the 95% case you actually see in practice.
Do-while loops: the latch test
The first structural analysis pass only emitted while loops. That's wrong for do-while loops, where the condition check is at the end of the loop body rather than the beginning.
The distinction is observable in the CFG: in a while loop, the condition is in the header block (the back-edge target). In a do-while loop, the condition is in the latch block (the block that has the back edge).
// from src/analysis/structuring.rs
fn collect_latches(cfg: &Cfg, dom: &DominatorTree) -> Vec<(usize, usize)> {
    // returns (header, latch) pairs for all back edges
    let mut latches = Vec::new();
    for b in &cfg.blocks {
        for &sa in &b.successors {
            if let Some(&sid) = cfg.addr_to_block.get(&sa) {
                if dom.dominates(sid, b.id) {
                    latches.push((sid, b.id)); // sid dominates b -> back edge -> sid is header
                }
            }
        }
    }
    latches
}
When we detect a loop header, we check: does the latch block end with a conditional branch, and is the latch block different from the header? If yes, it's a do-while. The latch block gets folded into the structure. Its non-branch instructions emit inside the closing brace, and the branch condition becomes the while condition:
do {
    // ... loop body ...
    // ... latch block instructions (minus the branch) ...
} while (rax < 0x10);
Switch tables: finally connecting those disconnected gotos
MSVC compiles switch statements as indirect jumps: jmp qword ptr [rip + reg*8 + disp]. The register holds the case index, and the memory operand points to a table of 64-bit code pointers (one per case). In Part 1 we noted that these produced unresolved successors; now we are going to fix them.
The fix lives in CfgBuilder::resolve_switch_table. It triggers on any Jmp instruction that has no resolved branch_target but does have a Mem operand with scale 4 or 8. Then:
- Calculate the table base address:
inst_end_va + dispfor RIP-relative forms - Read up to 256 entries from the binary, trying 32-bit RVA entries first (MSVC x64 default), then 64-bit absolute pointers
- Validate each entry against the known section list (entries pointing outside valid code sections get rejected)
- Stop at the first null entry or a duplicate (tables don't have infinite entries)
The valid targets come back as a Vec<u64>, which the builder adds to both the leaders set and the block's successor list. Now every case block has the right predecessor/successor wiring.
The structurer sees a block ending with an indirect jump and 3+ successors and recognises it as a switch:
switch (/* table index */) {
    case 0:
        // case body
        break;
    case 1:
        // case body
        break;
    // ...
}
The /* table index */ comment is a placeholder (recovering the actual register name requires tracking which register was used in the indirect jump's index field). That's a follow-up improvement. But at least the cases are connected now.
Performance: the debug-build trap
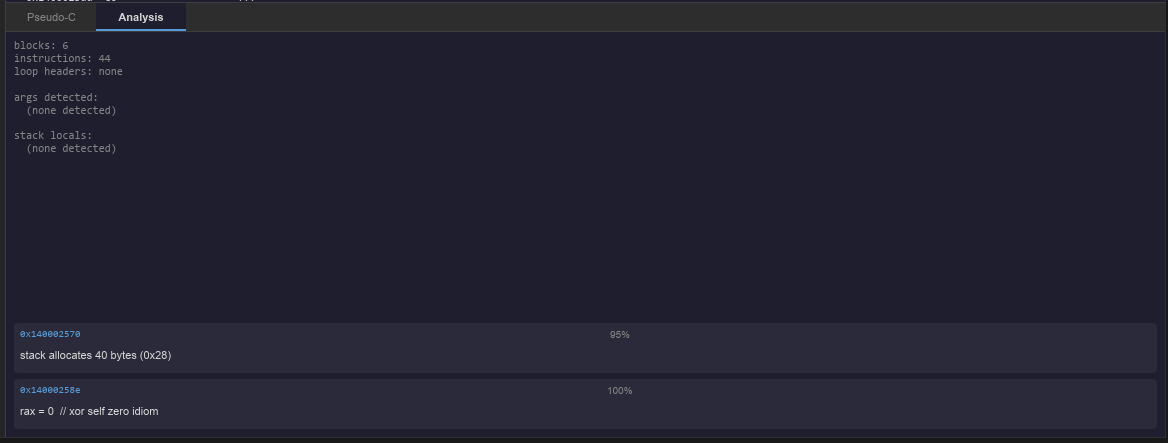
Before going further, a session went into a wall that didn't have to be there. After the Part 1 architecture improvements (moving analysis off the UI thread, using Arc<Vec<u8>> to avoid cloning the PE binary) the tool was still slow. Clicking a function in vkQuake took close to 20 seconds.
The timing instrumentation showed 1403 instructions, 209 basic blocks, taking 20 seconds total. So it couldn't have been a computation problem. That's clearly an optimization problem.
The entire time I had been running cargo build (Rust's debug profile). Debug builds do zero optimization (I knew this but honestly through all the work just skipped my mind). The decoder runs in a tight loop doing slice indexing and HashMap lookups thousands of times per function; in unoptimized code, each of those carries full bounds-checking overhead, there is no inlining, and no loop unrolling. For a decode-heavy tool the difference between debug and optimized is 10–50x.
The fix was one addition to Cargo.toml:
[profile.dev]
opt-level = 2

[profile.dev.package."*"]
opt-level = 2
opt-level = 2 is the sweet spot: nearly full optimisation, debugger still works, backtraces are readable, incremental rebuilds stay fast. The second line applies the same level to all dependencies, including Slint itself (which explained the sluggish panel scrolling even before a function was loaded).
After this change: the entry function of vkQuake (1403 instructions, 209 blocks) analyses in under 400ms. The tool went from barely usable to responsive. So tip for anyone else writing a decode-heavy tool in Rust, set opt-level = 2 in the dev profile on day one. Running in debug and observing bad performance tells you almost nothing useful.
The triple-decode problem
One other performance find: The way I had written the analyzer, it was decoding the same function region three times per click.
- First pass to collect branch targets (needed for the assembly listing)
- Second pass to build the assembly text strings
CfgBuilder::build_with_sections: a full third decode to build the CFG
The fix was pretty simple, we just do one pass that collects Vec<Instruction> and branch targets simultaneously. Assembly text is built from the pre-decoded list. The CFG builder gets a new build_from_decoded(insts, ...) path that takes the already-decoded list and does the leader/block/predecessor passes without re-decoding.
This cuts roughly a third of the decode work per function selection, and for 1403-instruction functions that's pretty significant. More importantly, the three-pass structure was a latent bug: if the decoder behavior changed slightly between calls (it shouldn't, but still), you'd get inconsistency between the assembly display and the CFG. Where as now there's one source of truth.
The CFG graph view
With structural analysis working, the next obvious addition was a visual CFG (the same kind of graph view you see in IDA or Ghidra), where nodes are basic blocks and edges are branches. It's the most immediately useful thing we've built from a usability standpoint, and it's photogenic enough to justify its own section.
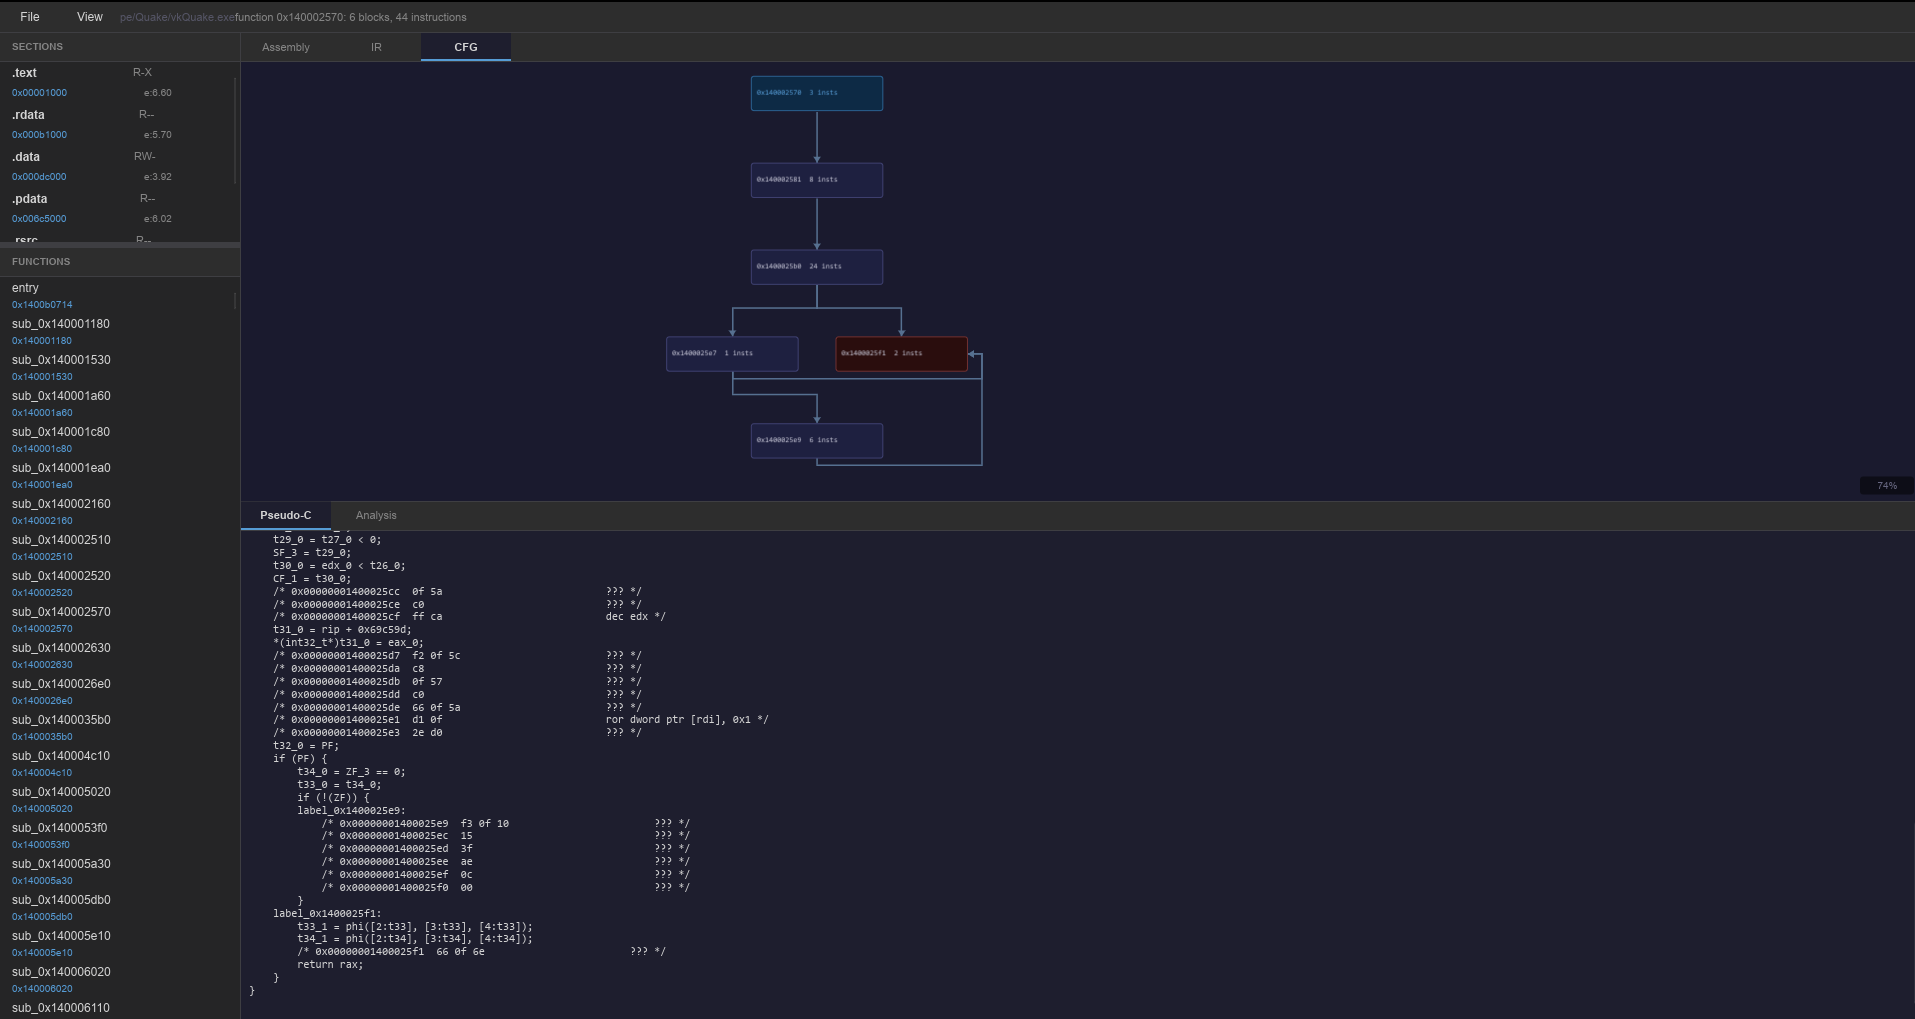
The layout algorithm: Sugiyama
Force-directed layouts (like graphviz neato) produce visually appealing results for arbitrary graphs but are iterative, non-deterministic, and produce different layouts for the same input on different runs. For a decompiler that's wrong, you want the entry at the top, the exit at the bottom, and the layout to read top-to-bottom like code. IDA and Ghidra both use the Sugiyama layered layout for exactly this reason.
Acheron's implementation is a simplified four-step Sugiyama:

Step 1 — Layer assignment via BFS depth. Each block gets a layer equal to its BFS distance from the entry block. Unreachable blocks go to max_layer + 1 rather than being silently dropped.
Step 2 — Column ordering via barycenter heuristic. Within each layer, blocks are sorted by the average column position of their predecessors in the layer above. This is a single forward pass; the full Sugiyama algorithm does multiple passes with a median heuristic for crossing minimisation. For typical function CFGs (mostly straight-line with if/else branches and one or two loops) the single-pass version looks clean without the complexity.
Step 3 — Pixel coordinates. Each layer is horizontally centered on the canvas. Block size is 180 × 50px, with 50px horizontal gaps and 70px vertical gaps. These numbers are constants at the top of layout.rs and easy to tune.
Step 4 — Edge routing. Three cases:
- Same column → straight vertical line
- Different columns → elbow route with a horizontal segment midway between layers
- Back edges (loops) → right-side bypass: exit the source block from the bottom, go right past the rightmost of the two blocks, come up, enter the target from the right side. This keeps loop back edges visually distinct from forward edges.
// from src/cfg/layout.rs
if is_back {
    let right_x = sx.max(tx) + NODE_W + 20.0;
    let enter_y  = to_y + NODE_H / 2.0;
    push_line(&mut lines, &[
        (from_x, from_y),
        (from_x, from_y + 10.0),
        (right_x, from_y + 10.0),
        (right_x, enter_y),
        (tx + NODE_W, enter_y),
    ]);
    push_arrowhead_left(&mut heads, tx + NODE_W, enter_y);
} else if (from_x - to_x).abs() < 2.0 {
    // straight vertical
    push_line(&mut lines, &[(from_x, from_y), (to_x, to_y)]);
    push_arrowhead_down(&mut heads, to_x, to_y);
} else {
    // elbow
    let mid_y = from_y + V_GAP * 0.45;
    push_line(&mut lines, &[
        (from_x, from_y), (from_x, mid_y),
        (to_x, mid_y), (to_x, to_y),
    ]);
    push_arrowhead_down(&mut heads, to_x, to_y);
}
The output is two strings of SVG path commands: one for edge lines (stroke only), one for arrowhead triangles (fill only). Keeping them separate is important, and that reason comes up in the "what went wrong" section below.
Rendering in Slint
GraphView in graph_view.slint takes the node list and the two path strings and renders them:
// edge lines (stroke only), fill: transparent
if edge-lines != "": Path {
    x: pan-x; y: pan-y;
    width: graph-width * zoom * 1px;
    height: graph-height * zoom * 1px;
    viewbox-width: graph-width; viewbox-height: graph-height;
    commands: edge-lines;
    stroke: c-edge;
    fill: transparent;
}

// arrowhead triangles (fill only), stroke: transparent
if edge-arrowheads != "": Path {
    commands: edge-arrowheads;
    fill: c-edge;
    stroke: transparent;
    stroke-width: 0px;
}
Nodes are a for node in nodes: Rectangle loop. Entry block gets a blue tint, return blocks get a red tint, ordinary blocks are dark purple. Label shows address and instruction count. A zoom percentage indicator sits in the bottom-right corner.
Pan and zoom
The graph view supports drag-to-pan and scroll-wheel zoom. Both are implemented in the TouchArea:
// seeding the drag origin on mouse-down
pointer-event(e) => {
    if e.kind == PointerEventKind.down && e.button == PointerEventButton.left {
        last-drag-x = self.mouse-x;
        last-drag-y = self.mouse-y;
    }
}

// per-frame delta pan
moved => {
    if self.pressed {
        pan-x += self.mouse-x - last-drag-x;
        pan-y += self.mouse-y - last-drag-y;
        last-drag-x = self.mouse-x;
        last-drag-y = self.mouse-y;
    }
}

// zoom centred on cursor
scroll-event(e) => {
    let factor    = e.delta-y > 0px ? 1.1 : 0.9;
    let new-zoom  = (zoom * factor).clamp(0.2, 4.0);
    pan-x = self.mouse-x - (self.mouse-x - pan-x) * (new-zoom / zoom);
    pan-y = self.mouse-y - (self.mouse-y - pan-y) * (new-zoom / zoom);
    zoom  = new-zoom;
    EventResult.accept
}
The zoom formula keeps the canvas point under the cursor stationary as you zoom. Mathematically: the cursor is at position (cx, cy) in screen space. The point at cursor is at canvas position (cx - pan_x) / zoom. After the zoom changes, you want that canvas position to still be under the cursor: pan_x_new = cx - canvas_pos * new_zoom = cx - (cx - pan_x) * (new_zoom / zoom).
Splitting the Slint files
While adding the graph view, main.slint was getting long enough to be uncomfortable to navigate, so I finally split it into three focused files:
| File | Contents |
|---|---|
ui/components.slint | MenuItem, MenuSep, TabBar (reusable primitives) |
ui/graph_view.slint | GraphView component, GraphNode struct |
ui/main.slint | top-level MainWindow, imports, tab wiring |
Slint's compiler follows import statements automatically so build.rs didn't need to change. Each file is now a coherent unit. The graph view knows nothing about the rest of the UI. The main window just assembles the pieces.
The tab bar is a new reusable component. It takes a [string] model and an active-tab: int property. Adding a new tab is one string addition. The active tab gets a 2px blue bottom border; inactive tabs dim to muted grey. Slint's if top-tab == N: conditional rendering means the inactive panes aren't in the element tree at all.

What went wrong
The arrowhead fill bleed
The first version of the graph view put all edge lines and arrowhead triangles into a single Path element with fill: c-edge. Slint's Path fills every closed subpath. An arrowhead is a closed subpath (M L L Z). Edge line segments are open polylines. But the implementation also accidentally closed some edge paths because of how the M/L commands were structured, and the fill flooded across large areas of the canvas (giant blue blobs instead of arrows).

The fix was simple we just split the path string into two. Edge lines use fill: transparent (stroke only). Arrowheads use stroke: transparent (fill only). This is why GraphLayout has edge_lines and edge_arrowheads as separate strings rather than one combined edge_commands. The Rust layout code and the Slint component were both modified to carry the split.
The pan acceleration bug
This one was entertaining to debug. The first pan implementation used pressed-x/pressed-y from the TouchArea:
// WRONG - pressed-x is the drag ORIGIN, stays constant for the whole drag
pan-x += self.mouse-x - self.pressed-x;
pan-y += self.mouse-y - self.pressed-y;
pressed-x is the mouse position when you first clicked. It's constant for the entire drag. So on every moved event, self.mouse-x - self.pressed-x is the total displacement since the drag started, not the delta since the last frame. Adding the total displacement on every frame causes exponential runaway (the graph accelerates away from the cursor and disappears off-screen).
The fix was to track previous frame position ourselves:
// correct: seed on mouse-down, use per-frame delta
pointer-event(e) => {
    if e.kind == PointerEventKind.down && e.button == PointerEventButton.left {
        last-drag-x = self.mouse-x;
        last-drag-y = self.mouse-y;
    }
}
moved => {
    if self.pressed {
        pan-x += self.mouse-x - last-drag-x;
        pan-y += self.mouse-y - last-drag-y;
        last-drag-x = self.mouse-x;
        last-drag-y = self.mouse-y;
    }
}
This is a known gotcha with any event-driven UI framework: "pressed position" is the origin, not the previous frame — that's because the delta has to be computed from a running variable, not from the press origin.
Where Part 2 stands
At the end of this post, Acheron can:
- Recover
if/else,while,do-while, andswitchstructures from the dominator tree - Find join blocks accurately using a proper post-dominator tree
- Simplify SSA flag chains back to readable conditions like
rcx != rdxandrax < 0x10 - Resolve MSVC switch tables and wire the case blocks into the CFG
- Render a visual CFG graph with pan and zoom, matching the layout style of IDA/Ghidra
- Do all of that from a single decode pass instead of three
The pseudo-C is still rough around the edges. Variable names are SSA temporaries (t0, rcx_2) rather than inferred names. Struct accesses look like load64(rcx + 0x28) instead of obj->field. Type information doesn't exist yet. All of that is Part 3.
What's next
Part 3 — Type Recovery: this is where the pseudo-C starts looking like something a human might have written. If a value is loaded through, it's a pointer. If a pointer is accessed at multiple constant offsets, it's probably a struct. If a value is used as an array index multiplied by a power-of-two constant, it's probably an array element. Type propagation through assignments. The goal is player->health instead of *(int32_t*)(rcx_2 + 0x14).
Part 4 — Function Discovery: the current implementation starts from the PE entry point and walks call targets. That only finds functions reachable from entry. Real tools need to find everything: CALL target harvesting, prologue pattern matching, gap analysis. vkQuake has about 1400 functions according to its symbol table; we're currently finding maybe 400 of them.
Part 5 — Compiler Fingerprinting: at some point we turn the analysis backwards and ask what we can learn about the compiler that produced the binary. Calling convention detection, code generation idioms, MSVC vs Clang patterns. vkQuake is a useful target here because we have the source and can verify.
The graph view makes Part 3 directly observable, once we start inferring types, we'll be able to see which nodes produce pointer values and which consume them, right there in the CFG. That feedback loop between the visual representation and the analysis work is one of the main reasons we added it now rather than later.
Code not yet published — will land alongside Part 3 or when it's in a state worth sharing. vkQuake is still the primary target throughout.